Observing glaciers in “real time”
Hot summers cause glaciers to melt. That not only changes the makeup of the landscape and hence the maps of Switzerland, it also affects every area of society. A new, dynamic glacier inventory makes the impact of climate change and the changing landscape visible.
The last time Swiss glaciers managed to grow at all was in 2001. Since then, the country’s 1,500 glaciers – as well as others elsewhere – have been suffering a slow but inexorable death. Until now, though, we have understood only partially how quickly they are really disappearing, and what effect that has on the landscape, people and animals. That is about to change, thanks to the Glacier Monitoring in Switzerland (GLAMOS) project. GLAMOS is working on behalf of various Swiss federal offices to put together a comprehensive inventory of the country’s glaciers – at an unprecedented level of detail.
But why bother compiling such a detailed inventory of a dying “species”? For GLAMOS geoinformatics expert and ETH employee Yvo Weidmann, the reason is obvious: “Glacial melt affects the flow rate of our rivers, which makes it a relevant factor in natural catastrophes, disaster prevention, the power supply, transportation, tourism, building sites and not least glacier research.”
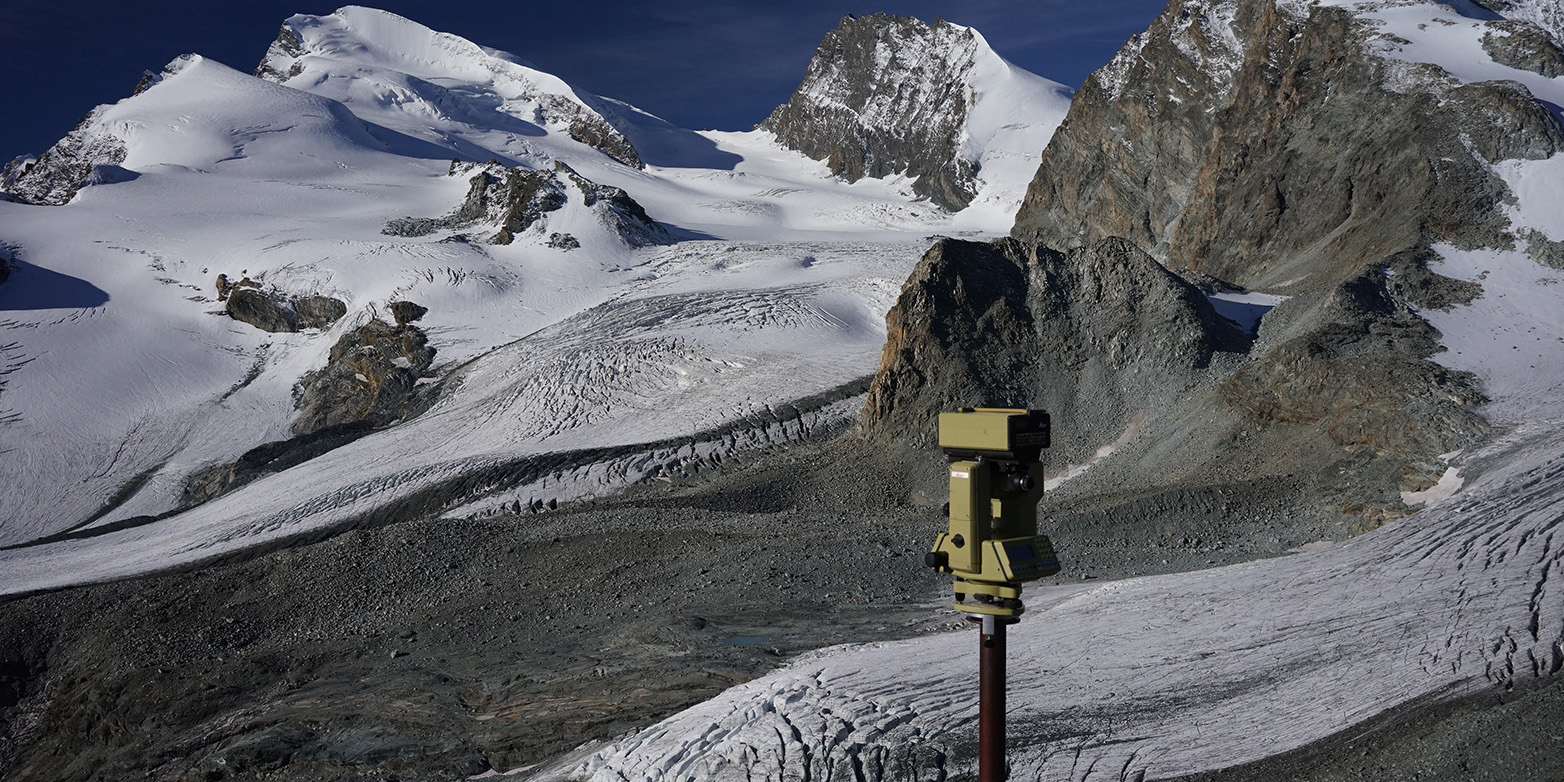
Today, GLAMOS is monitoring some 100 glaciers, with a particular view to measuring fluctuations in their length and ice thickness. In future, it will gather data on the extent of some 1,500 glaciers, helping tomorrow’s researchers to track even the tiniest changes in their extent.
From maps to a digital 3D landscape model
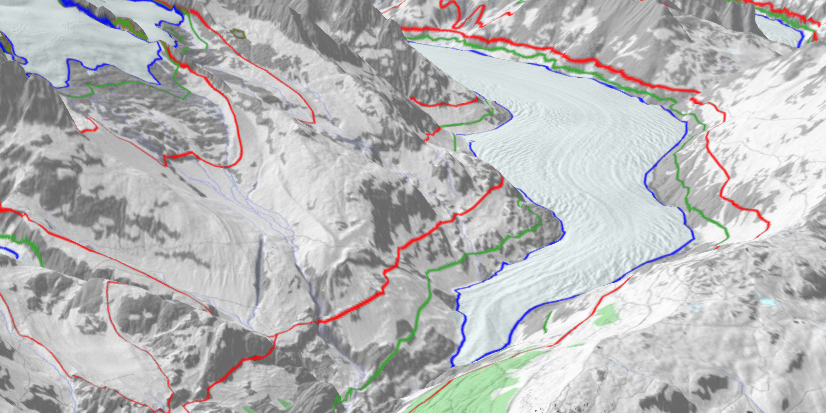
What makes the new inventory possible is a paradigm shift at the Swiss Federal Office of Topography, or swisstopo: it has spent several years painstakingly converting its maps into a digital 3D landscape model. The earlier maps show – to put it simply – where things are, but this basic view was of no use in glacier research.
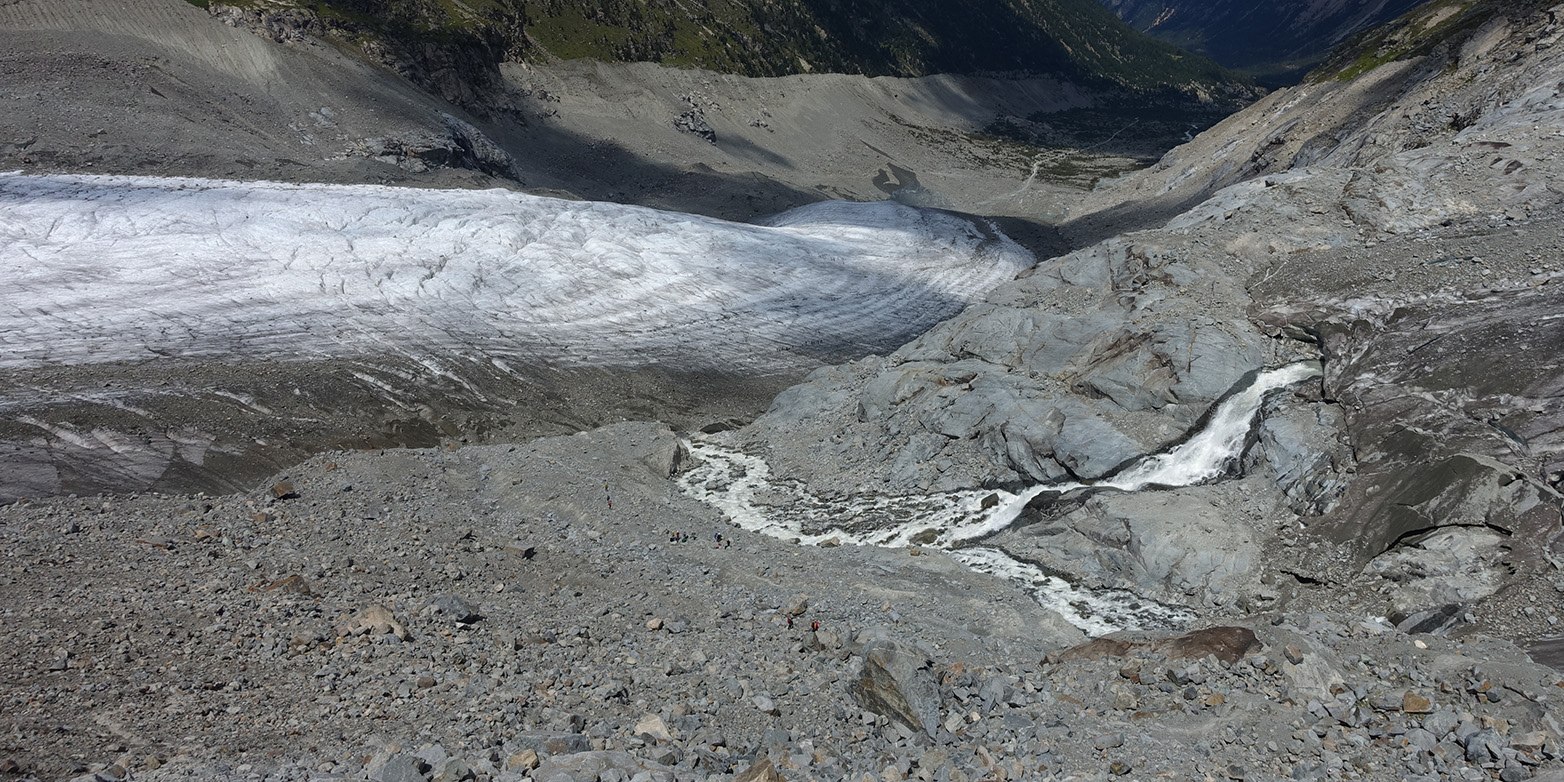
Glaciers can be covered by debris, which is relevant for glaciology. “It’s possible for a major proportion of a glacier snout to be hidden by debris, with the visible body of ice representing only part of the actual glacier,” Weidmann says. This means a purely cartographical representation of the area of visible ice comes up literally too short.

Ice fields become glaciers
In the topographical landscape model, this limitation falls away. The digital representation makes it possible to combine various layers along topographical rules. For instance, forest and bodies of water can touch but not overlap. Boulders can lie on top of ice. And liquid water – for instance glacial lakes – can be present over ice. Layers can be added or removed on the computer, producing a comprehensive model of the landscape that is fit for all possible purposes.
Now for the first time, swisstopo’s new landscape model also records glaciers according to glaciological rules. For instance, it is sometimes the case that two glaciers, located on opposite mountain flanks and with opposing directions of flow, will meet along a mountain ridge. From a cartographical viewpoint, this would be treated as a single large area of ice. But from a glaciological viewpoint, these are two “individuals” that have little in common and no effect on each other – apart from where they brush against each other on the mountain ridge.
“In future, glaciers will be given a unique number to make their history traceable,” Weidmann explains, adding, “Should a glacier with two catchments in two different valleys melt to the extent that it becomes two independent glaciers, one of them will be assigned a new number.” These inventory numbers not only make it easier to identify glaciers, they also help to document their history.
A model of unprecedented precision
By linking the inventory to glaciological computational models, researchers can show how much water each glacier will deliver and when.
The more data that flows into the model, the more precise the basis on which to make predictions. As a result, GLAMOS achieves an unprecedented level of precision. Every four to six years, swisstopo aircraft record each square metre of Switzerland. The 3D images generated are capable of showing changes in altitude across a grid of two metres by two metres to an accuracy of some 50 centimetres. If an area of gravel sediment ahead of a glacier snout sinks noticeably between two measurements, there is probably ice under it. The true proportions of the glacier below are better documented with each subsequent measurement.
A treasure trove of data
The first complete inventory of glaciers was drawn up in 1973. Later, a second inventory was reconstructed for the year 1850 based on estimates, maps and moraines. Additional surveys followed in 2000 and 2010. All these inventories were important for research, but each was produced using its own set of rules and different methods, making them barely comparable.
From 2019, Switzerland will for the first time be able to turn to a glacier inventory that will undergo dynamic further development and be completely renewed every four to six years. And the cost of the new glacier inventory is manageable because GLAMOS is drawing on existing troves of data, processing them, interlinking them and making them available in a format that a wide audience can use.
What is GLAMOS?
The Swiss Glacier Monitoring Network documents long-term fluctuations in glaciers located in the Swiss Alps. It is jointly operated by Sciences Switzerland’s Cryospheric Commission, the Laboratory of Hydraulics, Hydrology and Glaciology (VAW) at ETH Zurich, and the Universities of Fribourg and Zurich. Images are secured with financial support from the Swiss Federal Office for the Environment, MeteoSwiss, and the Swiss Academy of Sciences (SCNAT).
Summer series
Finally holiday time: ETH News will present a special summer series during the break, with a new focus periodically. Already published in this series:
11.07. Sweating for a cooler Singapore
18.07. Learning to work scientifically
30.07. Cooking even when the wind blows


Comments
No comments yet