We need to deal with the uncertainties in statistics
We look for certainty in uncertain times. But that is not something statistics can necessarily provide. Tanja Stadler explains why it is important to consider statistical uncertainty through describing the COVID-19 R value estimation which she performs for Switzerland.

Are the number of COVID-19 infections in Switzerland currently rising exponentially or are they falling? And how fast do the new variants of the virus spread compared to the old ones? We are assessing these questions using statistical data analysis. We of course would like to be able to provide very clear and unambiguous answers. Sometimes that is possible, but not always. In fact, when it comes to our lives in the real world and to diseases, the underlying processes rarely follow a deterministic pattern.
No matter which aspect of life we look at, there is almost always some degree of fluctuation or variation. Think about, say, your commute to work. The duration of the journey is never exactly the same, however, we are still very good at estimating how long it will take. Or take a seven-year-old boy. According to the growth chart, he is expected to be 1.25 metres tall at that age. In fact, if his height is anywhere between 1.15–1.35 meters, he is still fully within the normal range.
“A point estimate is not sufficient to provide the full picture of the epidemiological situation.”Tanja Stadler
The pandemic is no exception. If one person carrying SARS-CoV-2 infects on average one other person, what this really means is that some people carrying the disease infect several other people, while others infect nobody else at all. Another example is the incubation period – the time between being infected with the virus and the onset of the first symptoms. On average, this period lasts five days. In reality, however, it may be three days for some patients and seven or eight days for others. Further, there is the number of daily new infections on which we base our evaluations. This number also fluctuates from day to day.
The range of uncertainty is key
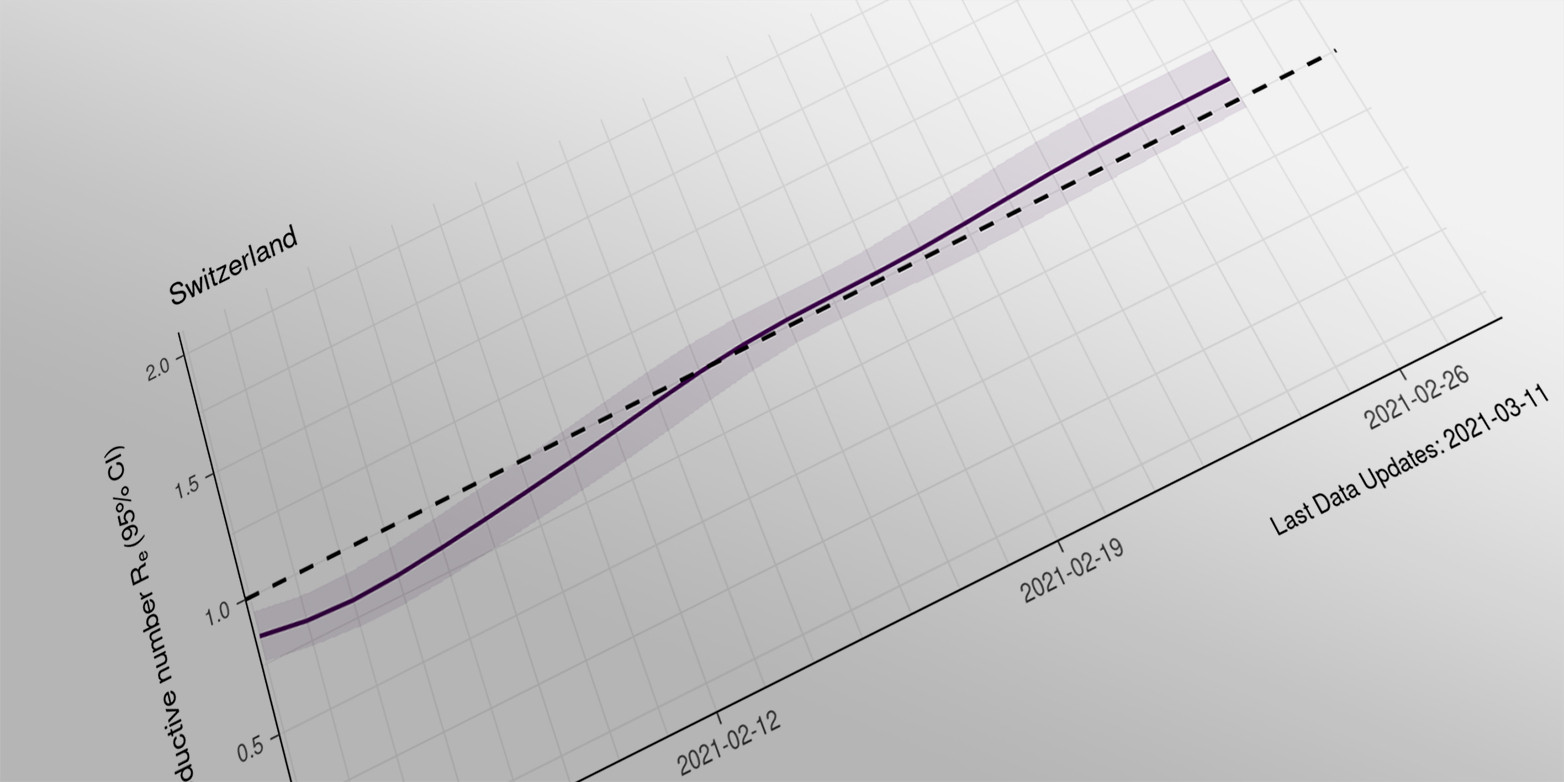
In my group, we estimate the R value for the COVID-19 epidemic in Switzerland1. If this value is greater than 1, the virus is spreading exponentially in the population. In our estimates, we take into account fluctuations including the ones mentioned abov. This means that the estimates we provide are never a precise value, but rather a range of values.
So we can say that the R value estimate for Switzerland is currently between 0.96 and 1.21. This statement is statistically robust. The range between the values is what we call the uncertainty interval. We also report the number that lies in the middle of this range – the point estimate. This is the best estimate for a single value. However, it is important to not overinterpret this number.
“Reliable” statement and cautious interpretation
If the estimated uncertainty interval of the R value is not fully below 1 or fully above 1, we cannot say with statistical significance if we are in a phase of exponential growth; in that situation it’s not possible for us to make a “reliable” statement. We can only talk cautiously about some trends.
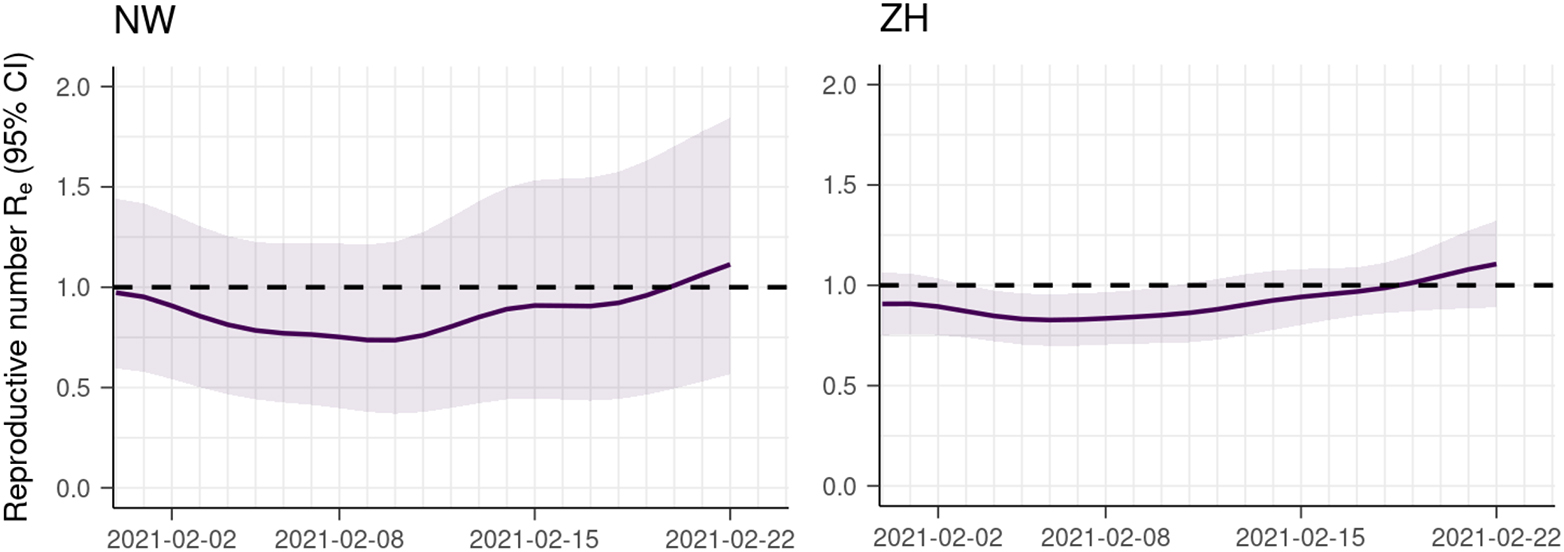
Fluctations are very prominent in small datasets while the may balance out in large datasets. Thus, the smaller the set of available data, the wider the range of uncertainty becomes. This pattern is for example observed in the data from the small cantons in Switzerland. Available data is not sufficient to make statistically significant statements as uncertainty intervals are very large.
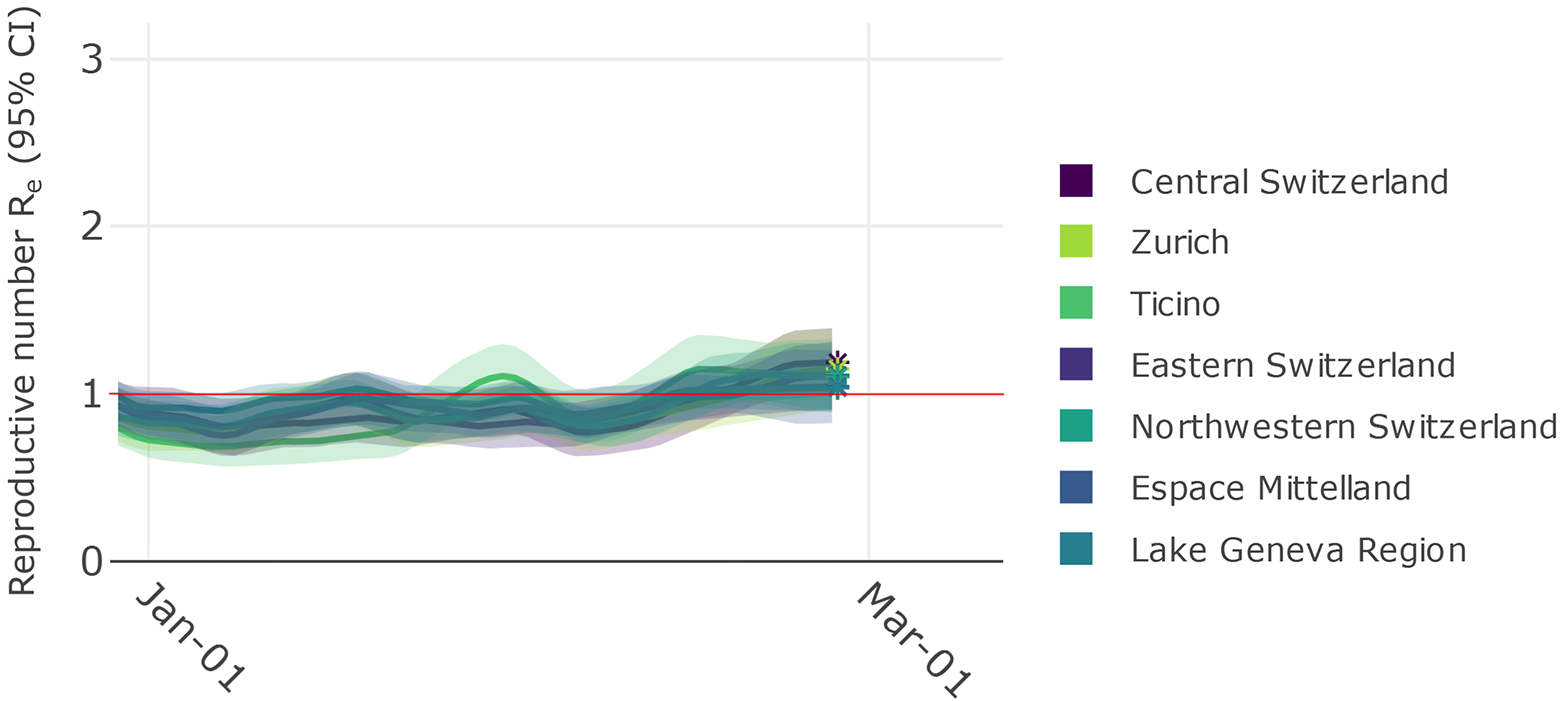
I prefer to focus on the seven major regions of Switzerland. People move a lot within these regions. When looking at these regions, we can identify trends. At the moment, the point estimate for the estimated R value is above 1 in all seven of Switzerland’s major regions. Even if it is not possible for us to make a significance statement about the estimated R value, we can still interpret the data. Unfortunately, the point estimates for all regions strongly suggest that the virus is currently in a phase of exponential growth in Switzerland.
Estimating the R value alone is not enough
Estimates of the R value can provide insights into the potential direction where the pandemic might develop. However we always need to take the range of uncertainty into account and interpret the data with caution. Further, it is crucial to further take into account other pandemic-related parameters in order to obtain a comprehensive assessment of the situation. A point estimate alone is not sufficient to provide the full picture of the epidemiological situation.
We would like to have some certainty in these uncertain times. But that is not something statistics can necessarily provide. We cannot get rid of the statistical uncertainty. It is a direct consequence of the fact that we are dealing with real-world events. Thus, we have to accept the uncertainty and, as a society, find a way to deal with it. In our team, we pursue the goal of identifying epidemiological dynamics based on the data we have available, highlighting possible scenarios and quantifying these scenarios by calculating probabilities. How to use such scientific insights is then up to policymakers and society as a whole to decide.
Amendment dated 15.03.2021:
The estimate for the R number of Switzerland is continuously updated as new data is available. Currently, the most recent range of estimates is from 1.00 to 1.26.
Comments
No comments yet